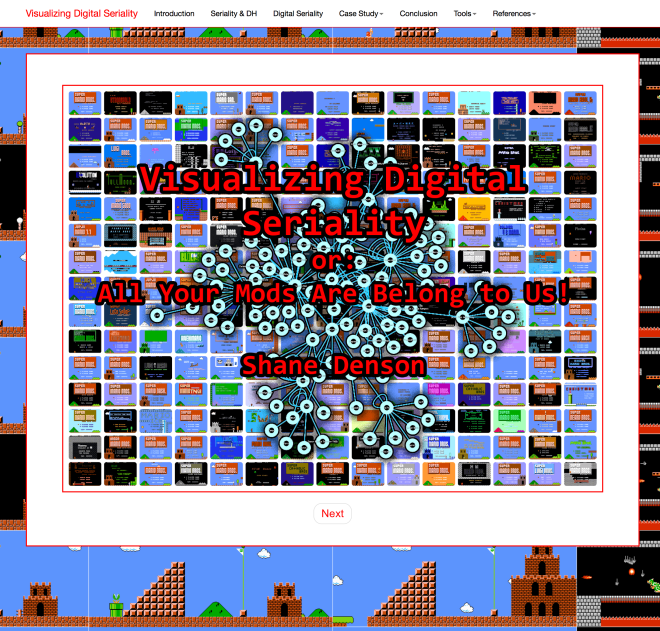
The short videos below (all under 1 minute in length) demonstrate the interactive components included in “Visualizing Digital Seriality, Or: All Your Mods Are Belong to Us!”—a digital humanities/critical code studies project utilizing visualization and other software tools to study exchanges of code and community-building in the Super Mario Bros. modding scene—published in Kairos: A Journal of Rhetoric, Technology, and Pedagogy 22.1 (August 2017): http://kairos.technorhetoric.net/22.1/topoi/denson/index.html
The videos, which use IBM Watson’s text-to-speech generator for voiceovers, were produced just in case any of the interactive functions ever stop working, but they also serve to show what you can do with my webtext (as Kairos refers to this type of multimodal scholarship).
1 – Mods & Interfaces
This page allows users to filter and sort the title screens of 240 Super Mario Bros. mods, all taken from ROMhacking.net’s database. Sorting and filtering can be done by year, by modder, and by mod name, as well as through a quick search via text input. Dropdown lists appear when the mouse hovers over “Year,” “Modder,” or “Title,” allowing the user to select parameters by checking the relevant boxes. Sorting can be done with the buttons below: “Sort by Date,” “Sort by Modder,” or “Sort by Mod Title.”
http://kairos.technorhetoric.net/22.1/topoi/denson/screens-page/index.html
2 – Basic Metadata
This page offers visualizations of basic metadata derived from ROMhacking.net’s collection of Super Mario Bros. mods. The interactive visualizations contain basic information on the number of mods released each year, the most active modders, and trends concerning the types of mods being produced. Additional information appears when the mouse hovers over the charts.
http://kairos.technorhetoric.net/22.1/topoi/denson/visualizations/basic-metadata.html
3 – Modder Networks (default view)
This interactive network graph visualizes the social networks among modders, as revealed in paratextual references in files distributed with mods (i.e. “shout-outs” in README.TXT and similar accompanying files). This is the default view. Each node represents an individual modder, while edges (lines) represent connections between modders. The user can change the visual style and layout via the dropdown menus on the left, as well as zoom in and out with the mouse wheel and rearrange nodes by holding and dragging them. Scrolling is achieved by holding and dragging the background.
http://kairos.technorhetoric.net/22.1/topoi/denson/visualizations/community.html
4 – Modder Networks (concentric view)
This interactive network graph visualizes the social networks among modders, as revealed in paratextual references in files distributed with mods (i.e. “shout-outs” in README.TXT and similar accompanying files). This is a concentrically arranged view. Each node represents an individual modder, while edges (lines) represent connections between modders. The user can change the visual style and layout via the dropdown menus on the left, as well as zoom in and out with the mouse wheel and rearrange nodes by holding and dragging them. Scrolling is achieved by holding and dragging the background.
http://kairos.technorhetoric.net/22.1/topoi/denson/visualizations/community.html
5 – Modder Networks (weighted)
This interactive network graph visualizes the social networks among modders, as revealed in paratextual references in files distributed with mods (i.e. “shout-outs” in README.TXT and similar accompanying files). Each node represents an individual modder, while edges (lines) represent connections between modders. In this view, node size corresponds to the number of references it has received (the more paratextual references, the larger the node). The user can change the visual style and layout via the dropdown menus on the left, as well as zoom in and out with the mouse wheel and rearrange nodes by holding and dragging them. Scrolling is achieved by holding and dragging the background.
http://kairos.technorhetoric.net/22.1/topoi/denson/visualizations/community.html
6 – Modding Communities
This interactive network graph visualizes connections between modders and various online modding communities, as revealed in paratextual references in files distributed with mods (i.e. references to various online communities and modding websites). In the default view, white nodes represent various mod files, while solid red nodes represent communities and websites referenced by them. The user can change the visual style and layout via the dropdown menus on the left, as well as zoom in and out with the mouse wheel and rearrange nodes by holding and dragging them. Scrolling is achieved by holding and dragging the background.
http://kairos.technorhetoric.net/22.1/topoi/denson/visualizations/community.html
7 – Extent of Modification
The visualization on this page offers information about the extent of modification that a given mod patch file instructs the computer to execute with respect to the original Super Mario Bros. ROM. The visualization provides basic numerical information about the amount of change contained in a mod or set of mods. It can be sorted and filtered by modder, mod, or by a range of particular byte addresses with the sliders and checkboxes on the right. The results, displayed on the left, can be sorted by title, year, or modder.
http://kairos.technorhetoric.net/22.1/topoi/denson/visualizations/extent.html
8 – Code “Diff”-Maps (Sorted by Date)
These visualizations offer the core means of conducting a “distant reading” of the code of all 240 Super Mario Bros. mods contained in the data set. Sorted here by date, these Gannt charts depict the location of byte-level modifications in the game ROM. The chart can be filtered by modder, mod title, and year via the checkboxes on the upper right, or by a range of particular byte addresses via the “Start” slider at the bottom right. The results, displayed on the left, can be sorted by date, modder, or title.
http://kairos.technorhetoric.net/22.1/topoi/denson/visualizations/diff-maps-by-date.html
9 – Code “Diff”-Maps (Sorted by Modder)
These visualizations offer the core means of conducting a “distant reading” of the code of all 240 Super Mario Bros. mods contained in the data set. Sorted here by modder, these Gannt charts depict the location of byte-level modifications in the game ROM. The chart can be filtered by modder, mod title, and year via the checkboxes on the upper right, or by a range of particular byte addresses via the “Start” slider at the bottom right. The results, displayed on the left, can be sorted by modder, date, or title.
http://kairos.technorhetoric.net/22.1/topoi/denson/visualizations/diff-maps-by-modder.html
10 – Diff Compare Mods (Patched ROMs)
This page enables low-level analysis of mod files, accessed here through a browser-based hex editor. To use the tool, the user selects two files (from the complete collection of patched ROMs, as well as the original unpatched ROM) from the dropdown menus below and clicks the button “Choose Files.” Afterwards, the hex code and ASCII representation of the patched ROM files will appear in the two boxes, with the differences between them highlighted. Scrolling is synchronized between the files displayed in the left and right boxes.
http://kairos.technorhetoric.net/22.1/topoi/denson/hexdump-diff/hexdump-diff.html
11 – Diff Compare Patch Files (Unpatched .ips Files)
This page enables low-level analysis of mod files, accessed here through a browser-based hex editor. To use the tool, the user selects two files (from the complete collection of unpatched .ips format patch files) from the dropdown menus below and clicks the button “Choose Files.” Afterwards, the hex code and ASCII representation of the patch files will appear in the two boxes, with the differences between them highlighted. Scrolling is synchronized between the files displayed in the left and right boxes.
http://kairos.technorhetoric.net/22.1/topoi/denson/hexdump-diff/ips-hexdump-diff.html